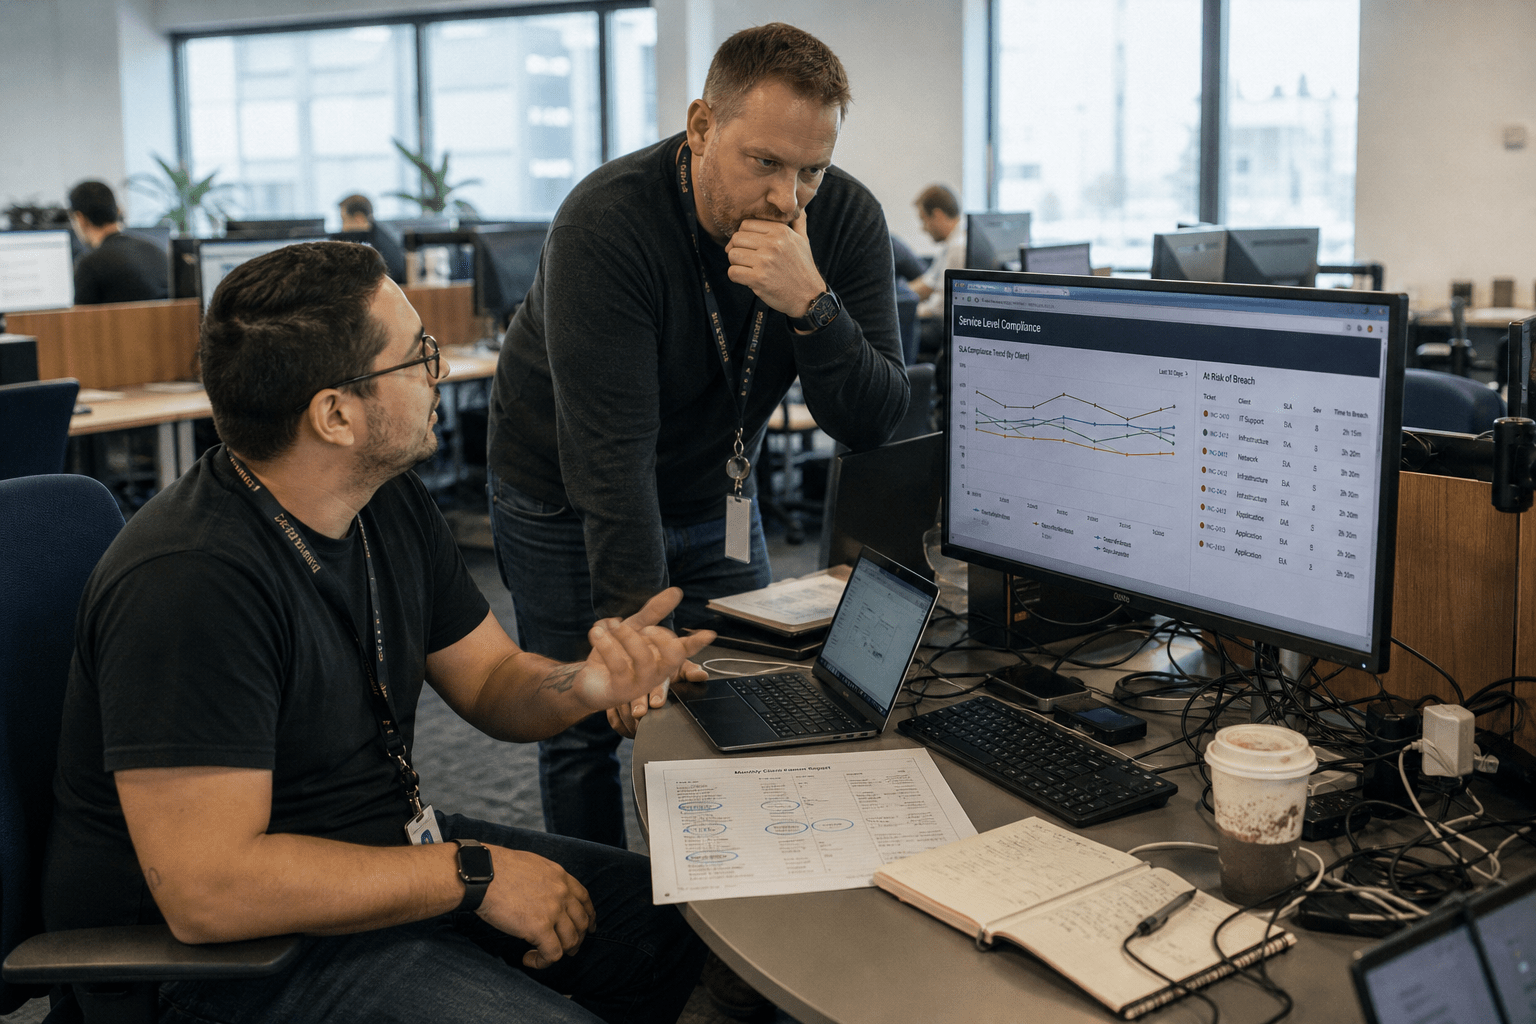
The best AI tools for MSP SLA monitoring in 2026 tell you a ticket is going to breach while you can still do something about it. Everything else in this category is accounting. A dashboard that reports last month’s breach count is a record of decisions already made, and no amount of visualisation turns a finished month into a manageable one.
Prediction is the capability worth paying for, and it rests on something unglamorous: whether your service level clocks are defined consistently. A model trained on ticket history where the clock pauses for different reasons at different technicians’ discretion will predict noise confidently. Fix the definitions first, and the prediction becomes genuinely useful. Skip that, and you have bought a more sophisticated way to be wrong.
Overview: five things that decide whether SLA tooling helps
- Prediction beats reporting. A warning while the ticket is open is worth more than an accurate month-end figure.
- Clock definitions have to be consistent before any model is trained on them. Discretionary pausing corrupts the history.
- Response time and resolution time behave differently. One is a staffing problem, the other is a complexity problem.
- Client-facing reports need to be readable, not complete. A twelve-page pack goes unread and settles nothing.
- Aggregate compliance hides the account that is about to leave. Look at per-client trend, not the fleet average.
Written for MSP owners, service delivery managers and internal IT leads accountable for service levels across a client base or an internal business.
Predicting a breach is the capability worth buying
Breach prediction works because the signals are present early. Ticket category, client, time of day, current queue depth, technician availability and the language of the initial description together carry a lot of information about whether something will land inside its window.
A model reading those at ticket creation can flag the ones heading for trouble, and a dispatcher can act while acting is still possible. That is a different product from a dashboard, and the difference in operational value is large.
Measure the prediction against your own history
Ask for a backtest on your data. Take the last six months of tickets, have the tool predict which would breach, and compare against what happened. A vendor able to do that has a defensible product, and one that cannot is asking you to trust an average across other people’s businesses.
Look at both error directions. A tool that flags everything catches every breach and tells you nothing. Precision matters as much as recall here, for the same reason it does in any alerting system: a warning nobody trusts is not a warning.
Act on the prediction, or do not buy it
A flagged ticket needs a defined response: reassign, escalate, notify the client proactively, or accept the breach knowingly. Without that, prediction is a more anxious form of reporting.
The proactive client notification is often the highest-value action and the least used. A client told at hour two that a complex issue will take longer than the standard window, with a reason and a revised commitment, is generally satisfied. The same client discovering a breach in a monthly report is not.
Clock definitions are the foundation everything rests on
Every service level number depends on definitions that are usually vaguer than anyone admits. When does the clock start, at ticket creation or at first business hour. When does it pause, and who decides. Does waiting on a client stop it. Does waiting on a hardware vendor.
If two technicians answer those differently, your historical data mixes several measurement schemes. Any model trained on it learns the inconsistency along with the pattern, and the resulting predictions are unreliable in ways that are hard to see.
Write the rules down and enforce them in the tool
The remedy is a written definition per service level, configured in the PSA rather than left to discretion. Pause reasons should be a short closed list with clear criteria, not a free text box.
This is a week of unglamorous work and it improves your reporting immediately, independent of any AI purchase. It also usually resolves a disagreement or two between service delivery and account management that had been running for years. The same discipline underpins the operational reporting we describe in AI operations monitoring.
Watch for pause abuse in the data
Once pausing is defined, look at who pauses what. A technician regularly pausing tickets shortly before a deadline is protecting a number rather than serving a client, and the pattern is easy to spot once you look.
This is not usually malice. It is a rational response to being measured on something they cannot always control, which is a management issue rather than a tooling one. It is worth naming because an AI tool will happily learn the behaviour and report improved compliance, and the failures underneath continue as described in our piece on managed IT services performance failures.
Response and resolution are different problems
Response time is a staffing and process question. Missing it means nobody picked the ticket up, and the fixes are coverage, routing and alerting. It is largely solvable with scheduling.
Resolution time is a complexity and dependency question. Missing it usually means the issue was harder than expected, a part was needed, or a third party was involved. Those are not fixed by working faster, and treating them as the same failure produces the wrong management response.
Separate the reporting, and separate the targets
Report them separately and set targets separately by category. A uniform resolution target across all issue types is a crude instrument that guarantees you miss on the complex ones and look effortlessly good on the simple ones.
Where dependency on a third party is the recurring cause, that is a supplier management conversation rather than a service desk one. It is also the kind of structural gap we cover in IT infrastructure service gaps, where the constraint sits outside the team being measured.
After-hours coverage distorts both
If your service levels apply outside business hours and your staffing does not, the numbers will show it. Some providers solve this with follow-the-sun coverage, some with an on-call rotation, and some by defining service levels that only apply during business hours.
All three are legitimate as long as the client agreement matches the reality. Disputes usually arise from a mismatch between what the contract promises and how the clock is configured, which is a resolvable problem if anyone checks. The overnight visibility question is covered further in our 24/7 threat monitoring guide.
Client reporting: shorter is better
Automated reporting is where AI tooling most obviously saves time, and the saving is frequently spent producing longer reports nobody reads. A twelve-page monthly pack with every metric present is a defensive document rather than a communication.
What a client wants to know is whether service levels were met, what went wrong if they were not, what is being done about it, and whether anything needs their decision. That fits on one page.
Generated narrative needs a human read
Tools that write the commentary as well as the numbers save real time and occasionally produce a sentence that is factually accurate and commercially unwise. An automated explanation attributing a breach to a client’s own delay may be true and still not something you want sent unreviewed.
Keep a human approving client-facing reports. The generation makes it a five minute review rather than an hour of assembly, which is the actual benefit. This matters most in shared-responsibility arrangements, where attributing a delay is genuinely contested, as we discuss in our piece on co-managed IT mistakes and in how we structure co-managed IT services.
Aggregate compliance hides the account you are about to lose
Fleet-wide compliance of 97 percent can contain one client at 78 percent whose renewal is in two months. The average is the number that goes in the board pack and the per-client trend is the number that predicts churn.
Configure alerting on per-client trend rather than on absolute threshold. A client sliding from 99 to 94 over three months is a more urgent signal than one sitting steadily at 93, because the direction is what the client is experiencing.
Tie it to the account conversation
The per-client trend should reach whoever owns that relationship before the client raises it. Arriving at a renewal discussion already knowing service has slipped, with an explanation and a plan, is a completely different conversation from being told.
That is also what clients are assessing when they evaluate providers, as our guidance on how to find the best managed service provider sets out from the buyer’s side. Where the underlying cause is infrastructure visibility rather than service desk capacity, it belongs with network security monitoring instead.
A practical evaluation sequence
Write down your clock and pause definitions and configure them in the PSA. Review three months of pause data for discretionary use. Ask each candidate tool for a backtest against your own six months of history, and look at both error directions. Define what happens when a ticket is flagged. Set per-client trend alerting. Then automate the client report and keep a human approval step.
Buying prediction before fixing definitions is the common error, and it produces a tool that is confidently wrong in ways that take months to notice, because a prediction that never gets checked looks exactly like one that works.
Frequently Asked Questions
Can AI actually predict an SLA breach before it happens?
Yes, where the historical data is consistent, because category, client, queue depth, time of day and technician availability carry real signal at ticket creation. The accuracy depends far more on whether your clock and pause rules were applied consistently than on the model itself.
What is the most common SLA reporting mistake?
Reporting the fleet average. Aggregate compliance of 97 percent can contain one client at 78 percent whose renewal is approaching, and the average is precisely what hides them. Alert on per-client trend rather than on an absolute threshold.
Should response and resolution have the same target?
No. Response failures are staffing and routing problems and resolution failures are complexity and dependency problems, so they need different targets by issue category and different management responses. A uniform resolution target guarantees you miss on complex work.
Can we automate client-facing service reports?
The assembly, yes, and the approval should stay human. Generated commentary is usually accurate and occasionally commercially unwise, particularly where it attributes a delay to the client. Review turns an hour of assembly into a five minute check.
Do we need to fix our PSA data before buying a tool?
Realistically yes for anything predictive. A model trained on history where pausing was discretionary learns the inconsistency along with the pattern. Defining the rules and configuring them is about a week of work and improves your reporting on its own.
Who is behind this guidance
Our team runs service delivery inside PSA and monitoring stacks for mid-sized providers and for internal IT groups measured the same way, which is where the gap between a compliance figure and a client’s experience becomes visible. We have reviewed pause data that showed a clear cluster of pauses shortly before deadlines, and we have also seen a per-client trend alert surface a slipping account two months before a renewal that would otherwise have been a surprise. Both are why definitions come before tooling in the sequence above.
Matt Rosenthal, our CEO, keeps the same question at the centre of service reporting: does this number describe what the client actually experienced, or what our configuration recorded. That distinction is why this article treats clock definitions as the foundation rather than a detail, and it shapes how we set up service reporting for the environments we run.
Fix your clock definitions before you shop for prediction
The providers whose service level programmes hold up in 2026 did the definitional work first. They wrote down when the clock starts and stops, closed the pause reasons to a short list, checked who was pausing what, and only then asked a tool to predict anything. The prediction was useful because the history underneath it meant one consistent thing.
If you are evaluating now, the question worth answering before any demonstration is whether two of your technicians would pause the same ticket for the same reason. If the answer is no, that is the project, and it improves your reporting whether or not you buy anything.
Book a free strategy call and we will review your service level definitions and reporting with you.