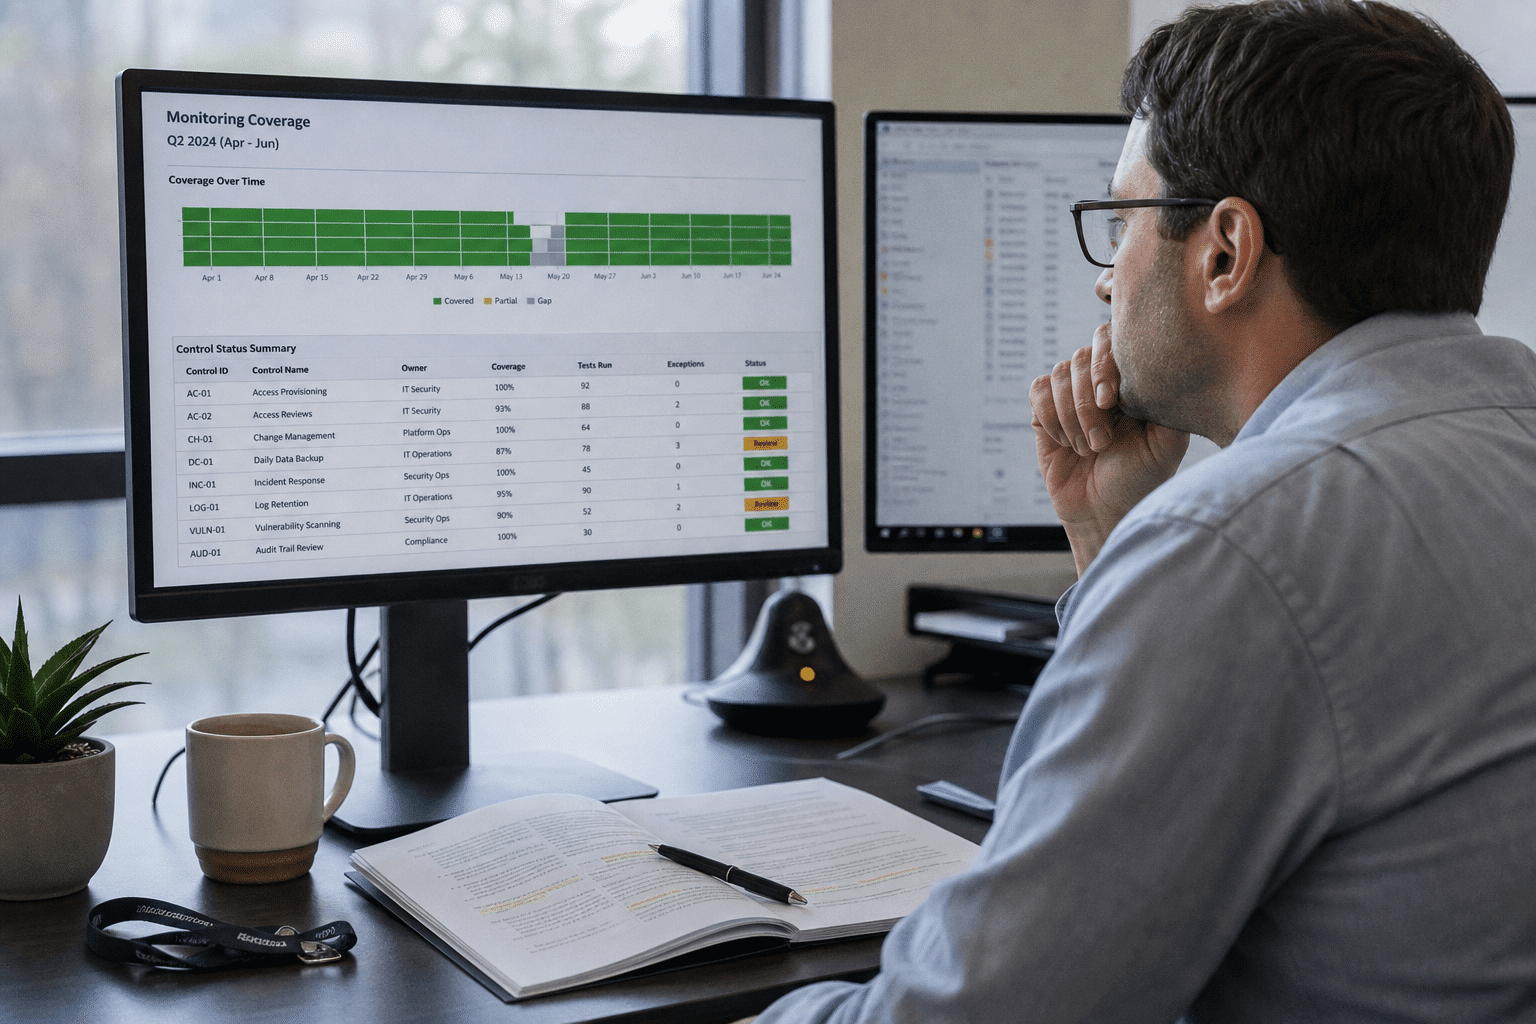
The best AI tools for continuous monitoring reporting are the ones that can prove coverage over a period, not the ones with the best live dashboard. An assessor reviewing your program is not asking what your control status is this morning. They are asking whether the control was under observation for the entire reporting period, and whether you would have known if it stopped being watched. Most products answer the first question beautifully and the second one not at all. A sensor that stopped reporting in week three produces a clean dashboard, because absence of alerts reads identically to absence of problems. Choose for coverage evidence and gap detection, and the reporting burden falls away as a consequence.
Why Monitoring Reports Pass Review and Still Miss the Point
Continuous monitoring reports satisfy a reviewer and still fail their purpose when they describe state rather than observation. Five patterns show up repeatedly in the programs we assess:
- The report shows current status only. A green control today says nothing about the ninety days the report supposedly covers.
- Sensor downtime is invisible. Agents that stopped checking in are counted as compliant hosts rather than unmonitored ones.
- Population and sample get confused. A report covers the forty servers with agents installed, while the estate holds fifty-eight.
- POA&M items age without movement. Findings roll forward quarter after quarter with the same target date and a fresh timestamp.
- The evidence is regenerated, not retained. Asked for March, the tool produces today’s view of March, which is not the same thing.
Each of these produces a document that reads well and cannot answer the one question that matters under scrutiny. Our notes on logging and continuous monitoring strategy cover the collection side that has to be right before any of this reporting works.
What Continuous Monitoring Reporting Has to Prove
Continuous monitoring reporting has to prove three things, and dashboards address only the first. It has to show the control’s state across time rather than at a moment. It has to show that the observation itself was continuous, naming any period where the sensor was down or the host was unreachable. It has to be retained in a form that can be produced later without recomputation. Our team treats those three as the buying criteria, because a program that cannot demonstrate them is doing monitoring without doing continuous monitoring.
Coverage Over Time, Not Status at a Moment
Coverage over time is the property assessors test and the one most tooling under-serves. In favour of time-series reporting: products that store control state as a series let you answer whether MFA enforcement held for the whole quarter, and show the four days in May when a conditional access policy sat in report-only mode during a migration. That is a defensible answer, and disclosing those four days is far stronger than a green tick that quietly averages them away.
The argument against leaning on it: time-series storage is expensive and many products down-sample older data, so the further back you look the coarser the record becomes. A tool retaining daily granularity for thirty days and weekly thereafter cannot answer a question about a specific Tuesday in March. We ask vendors directly what granularity survives at ninety days and at one year, because that number, not the dashboard, determines what your report can claim. Firms running formal programs should read our piece on continuous monitoring and incident response alongside this, since the two records get compared.
Knowing When the Watcher Stopped Watching
A silent sensor is the failure mode that turns a monitoring program into theatre, and it is worth buying for directly. Supporting automated gap detection: platforms that alert on agent check-in lapses, log volume dropping below a baseline, and hosts disappearing from inventory will catch the reimaged fleet that never got its agent back and the syslog forwarder that stopped after a firewall change. Log volume anomaly detection is the underrated one, because a forwarder can keep its connection open while sending nothing useful.
Against: gap detection generates a steady stream of low-value alerts, and teams tune it down until it stops firing. We have walked into environments where the coverage alerting was disabled months earlier for noise, which is worse than never having it, because the report still carries the assurance that it exists. The workable pattern is to treat coverage gaps as a weekly report line rather than a real-time page, and to make somebody accountable for reading it. That is one of the risks we cover in our guide to threat monitoring after hours, where gaps concentrate.
Reporting the Population, Not Just the Instrumented Part
Population accuracy decides whether your percentages mean anything, and it is the number most reports quietly get wrong. Arguing for tools that reconcile against an independent inventory: comparing the monitored host list against directory objects, cloud resource inventories, and network discovery finds the machines nobody instrumented. A report saying ninety-eight percent of monitored hosts are compliant is meaningless until you know monitored hosts are ninety-eight percent of hosts.
The counterargument is genuine. Independent inventories disagree with each other constantly, and reconciling them produces a list of discrepancies that are mostly stale directory objects rather than real unmonitored machines. Chasing that list to zero wastes weeks. Our practice is to reconcile quarterly, classify each discrepancy once, and carry a documented exclusions list rather than pretending the numbers match. An exclusions list a reviewer can read is a stronger artifact than a suspiciously clean hundred percent. This reconciliation is a standing part of our cyber security audits.
Where AI Genuinely Reduces the Reporting Burden
AI reduces the continuous monitoring reporting burden in narrative assembly and in anomaly triage, which are the two slow parts of producing a quarterly package. Narrative assembly means turning control state, exceptions, and gap records into the written summary a committee reads, and models are good at that when they are drafting from structured input rather than inventing context. Anomaly triage means separating the log volume drop that was a holiday weekend from the one that was a broken forwarder.
Both have a shared failure mode worth stating plainly. A generated narrative sounds authoritative regardless of whether the underlying data supported the claim, and a reviewer cannot tell the difference from the prose. We require every generated sentence in a report to carry a reference back to the record that produced it, and we read the exceptions section by hand every time. Automation drafting the routine paragraphs is a real saving. Automation writing the exceptions is how a program develops a blind spot it cannot see. The governance framing for this sits in our write-up on continuous monitoring and AI governance.
Separating a Quiet Weekend From a Broken Forwarder
Log volume anomalies are the highest-yield thing to triage automatically, because volume drops have many innocent causes and one dangerous one. Supporting automated triage: a model with several months of history learns that Saturday volume runs at a fraction of Tuesday, that the last week of December collapses across the whole estate, and that a particular application server goes quiet during its patch window. It can then flag the drop that does not match any of those patterns, which is the one worth a human look.
The argument against automating this: the model learns the environment as it was, so a legitimate change reads as an anomaly for weeks, and teams start dismissing the alerts. Worse, if a forwarder broke before the training window, the broken state becomes the baseline and its silence never registers as unusual. We seed the baseline from a period we have independently confirmed was healthy rather than from whatever data happens to be available, and we re-confirm after major infrastructure changes.
The practical version of this for a smaller firm is simpler than it sounds. Pick the ten sources that matter most, record their normal daily volume ranges once, and review a weekly report of anything outside those ranges. That catches most of what a sophisticated model would, and it fails visibly rather than silently, which is the property that matters in a control you are reporting on.
POA&M Items That Move
Plan of action items are where a monitoring program’s honesty becomes visible, because an item that never changes is a finding nobody owns. In favour of automated POA&M tracking: linking each item to the monitored control means the record closes when the underlying state actually changes, rather than when someone remembers to update a spreadsheet. Aging reports then show real movement, and a reviewer sees a program that works.
The limitation is that automatic closure is only as good as the link. An item written as remediate legacy authentication cannot be closed by any single control reading, because it spans several systems and a project. Those items still need human status, and pretending otherwise produces a POA&M that closes items which are not fixed. We split the register: control-linked items close automatically with evidence, project items carry a named owner and a date that someone defends at a monthly review. Ongoing coverage of the control-linked half is what our network security monitoring and AI operations monitoring services are built to produce.
Writing for Two Audiences Without Writing Twice
A monitoring report usually has to serve an assessor and a board, and those readers want opposite things. The assessor wants completeness: the population, the exclusions, the gap periods, the evidence references. The board wants the three sentences that tell them whether risk moved. Producing two documents doubles the work and guarantees they drift apart within a year.
In favour of a layered single report: write the detailed record as the source, then generate the summary from it, so the short version is provably consistent with the long one. When a board member asks where a number came from, the answer is a section reference rather than a rebuild. Tools that support this well let you tag sections by audience and render both views from one dataset.
Against: a layered document tends to get written for the assessor and summarised mechanically, which produces an executive summary that is accurate and unreadable. The summary needs an actual argument, which is a human judgement about what mattered this quarter. We draft the detail from the record, then write the summary by hand in three or four sentences, then check every claim in it against a section below. That last step is the one that gets skipped, and it is the one that keeps the two layers honest.
Frequently Asked Questions
What makes continuous monitoring different from regular monitoring?
Continuous monitoring is judged on the observation record, not just on detection. Regular monitoring asks whether you caught the problem. Continuous monitoring asks whether the control was demonstrably under observation for the whole period, including any interval when the sensor itself was down.
How long should monitoring evidence be retained?
Retain at a granularity that answers a question about a single day for at least one full assessment cycle, which is usually a year. Check what the product down-samples and when, because coarse historical data cannot support a claim about a particular date.
Can AI write our quarterly compliance report?
It can draft the routine narrative from structured control data, and that saves real time. Write the exceptions section by hand. Generated prose reads as confident whether or not the data supported it, and the exceptions are exactly where a reviewer will probe.
How do we handle hosts that cannot be instrumented?
Document them as a named exclusions list with a reason and a compensating control, and report percentages against the full population. A disclosed exclusion is defensible. A quietly reduced denominator that produces a perfect score is not.
What is the first thing to fix in a weak monitoring program?
Coverage gap detection, ahead of any dashboard work. Until you can tell the difference between a control that is healthy and a sensor that stopped reporting, every other number in the program rests on an assumption nobody has tested.
Who Is Behind This Advice
Our team builds and runs monitoring programs for firms that get assessed, and we have sat on the wrong side of the question about a quiet sensor. The lesson that stuck was not about tooling. It was that the report had no place to record what had not been watched, so nobody was lying and the gap still went unmentioned for a quarter. Since then we design the coverage record first and the dashboard second, which is the reverse of how most products are demonstrated.
The other thing experience changes is how you read a perfect report. A control set showing a hundred percent compliance across ninety days with no exceptions and no gaps is not usually a sign of an exceptional program. It is usually a sign that the report is measuring a narrow population, or that nothing is checking whether the checkers ran. We now treat an unblemished quarter as a prompt to verify the denominator rather than as good news, and that habit has found more real problems than any alert rule we have written.
Matt Rosenthal leads Mindcore and pushes for security programs that hold up under outside review rather than ones that only look healthy from the inside.
Build the Coverage Record First
The takeaway is worth acting on before your next reporting cycle closes. Continuous monitoring reporting stands or falls on whether you can prove the control was watched for the whole period, so build the coverage record before you invest in another dashboard. Store control state as a time series and find out what granularity survives at a year. Alert on sensor silence and log volume collapse, then put those gaps in a weekly line somebody is accountable for reading. Reconcile the monitored population against an independent inventory each quarter and keep a written exclusions list instead of a flattering percentage. Let a model draft the routine narrative from structured records, and write the exceptions yourself. Done in that order, the quarterly package stops being a scramble and starts being a by-product of a program that actually runs. If you want a second opinion on whether your current reporting would survive a careful reviewer, book a free strategy call and bring last quarter’s report.